Figures in our Statbank
On population we can present detailed, coherent and consistent statistical information for:
Population estimates: 1977-2015
Births: 1973-2014
Deaths: 1973-2014
Cause of Deaths: 1990-2012
Migration: 1993-2014
Internal migration: 1993-2014
In creating these tables the present administrative subdivision has been used and municipalities are as defined on January 1st 2009. At lower levels we use 2 concepts; districts are equivalent with municipalities prior to 2009 and localities. A locality is a place and can be any town, settlement, station, mine and can be inhabited or not. For definition we use the one ASIAQ (www.asiaq.gl) has determined. The Asiaq list on localities is as of now not complete with regards to historical localities.
To ensure consistency at detailed levels we have revised our data once again. Some minor inconsistencies have been corrected, and some differences can be found in comparing the revised tables with previously publications.
For fast access to a relevant table in the Statbank, links are found below each table and graph on the following pages.
Summary table 1. Population January 1st by gender, 2007-2015
|
|
2007 |
2008 |
2009 |
2010 |
2011 |
2012 |
2013 |
2014 |
2015 |
|
Total |
56.648 |
56.462 |
56.194 |
56.452 |
56.615 |
56.749 |
56.370 |
56.282 |
55.984 |
|
Men |
30.005 |
29.885 |
29.809 |
29.936 |
29.942 |
30.041 |
29.838 |
29.730 |
29.556 |
|
Women |
26.643 |
26.577 |
26.385 |
26.516 |
26.673 |
26.708 |
26.532 |
26.552 |
26.428 |
Visit our Statbank: ( http://bank.stat.gl/beest1 )
During 2014 total population fell by 298 persons. This is due to these changes:
Summary table2. Changes to the population in 2014
|
Population estimate January 1st 2014 |
56.282 |
|
+ births |
806 |
|
- deaths |
-464 |
|
+ immigrated |
2.148 |
|
- emigrated |
-2.733 |
|
- corrections |
-55 |
|
Population estimate January 1st 2015 |
55.984 |
In the Statbank you can combine information on residence, gender, mother’s age and place of birth from 1977 and onward. Geographically you can choose between municipalities, districts and localities. The most detailed table holds half a million table cells.
Summary table3. Births in the municipalities 2012-2014
|
|
2012 |
2013 |
2014 |
|
|
number of live births |
||
|
Total |
790 |
821 |
806 |
|
Kujalleq |
90 |
112 |
94 |
|
Sermersooq |
309 |
315 |
326 |
|
Qeqqata |
123 |
139 |
127 |
|
Qaasuitsup |
268 |
255 |
259 |
Visit our Statbank: ( http://bank.stat.gl/BEEBBLM2 )
From summary table 3 we learn that 806 children were born in 2014, which are 15 less compared to 2013. The relatively small birth cohorts from the mid-seventies has for most now completed their fertile period. They will be replaced by relatively larger birth cohorts in the coming years.
The fertility pattern has been unchanged with total fertility at reproduction level. Graph 1 shows the total fertility rates over the past 10 years. There are no major differences at the municipal level. But large differences can be found between towns and settlements. Visit our Statbank: http://bank.stat.gl/BEEBBSF2
Graph 1. Total fertility rates selected population groups 1977-2014
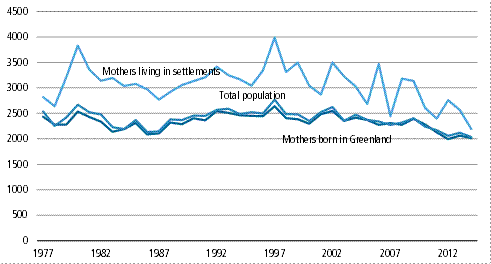
Visit our Statbank: ( http://bank.stat.gl/BEEFT )
Summary table4. Deaths in the municipalities 2013-2014
|
|
Men |
Women |
Total |
||||
|
|
2013 |
2014 |
2013 |
2014 |
2013 |
2014 |
|
|
|
|||||||
|
Total |
270 |
240 |
180 |
224 |
450 |
464 |
|
|
Towns |
224 |
202 |
157 |
188 |
381 |
390 |
|
|
Settlements |
46 |
38 |
23 |
36 |
69 |
74 |
|
|
Kommune Kujalleq |
|
|
|
|
|
||
|
Total |
45 |
43 |
39 |
43 |
84 |
86 |
|
|
Towns |
33 |
36 |
34 |
35 |
67 |
71 |
|
|
Settlements |
12 |
7 |
5 |
8 |
17 |
15 |
|
|
Kommuneqarfik Sermersooq |
|
|
|
|
|
||
|
Total |
91 |
86 |
57 |
58 |
148 |
144 |
|
|
Towns |
83 |
72 |
52 |
52 |
135 |
124 |
|
|
Settlements |
8 |
14 |
5 |
6 |
13 |
20 |
|
|
Qeqqata Kommunia |
|
|
|
|
|
||
|
Total |
44 |
42 |
28 |
45 |
72 |
87 |
|
|
Towns |
38 |
39 |
25 |
41 |
63 |
80 |
|
|
Settlements |
6 |
3 |
3 |
4 |
9 |
7 |
|
|
Qaasuitsup Kommunia |
|
|
|
|
|
||
|
Total |
90 |
69 |
56 |
78 |
146 |
147 |
|
|
Towns |
70 |
55 |
46 |
60 |
116 |
115 |
|
|
Settlements |
20 |
14 |
10 |
18 |
30 |
32 |
|
Visit our Statbank: ( http://bank.stat.gl/beebbdm2 )
In the graph 2 below the number of migrations by gender and place of birth 1993-2013 can be seen. Every year more people choose to emigrate than to immigrate. In 2013 2.066 persons immigrated while2.513 persons emigrated.
Graph 2. Migrations 1993-2014
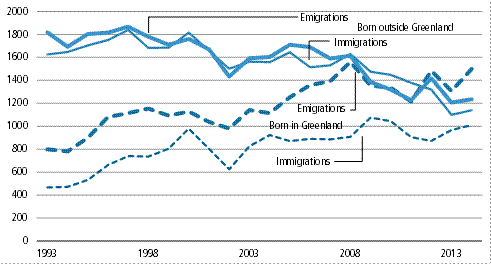
Visit our Statbank: ( http://bank.stat.gl/beebbiu2 )
23.110 changes of addresses were recorded in 2014, which is at same level as for the past 5 years. Most moving’s takes place within the same locality.
Summary table 5. Internal migrations 2014
|
|
Kommune Kujalleq |
Kommuneqar-fik Sermersooq |
Qeqqata Kommunia |
Qaasuitsup Kommunia |
Other localities |
Municipality of removal Total |
|
Municipality of migration |
3.228 |
8.260 |
4.351 |
7.260 |
11 |
23.110 |
|
Kommune Kujalleq |
2.617 |
291 |
115 |
126 |
2 |
3.151 |
|
Kommuneqarfik Sermersooq |
359 |
7.030 |
441 |
591 |
4 |
8.425 |
|
Qeqqata Kommunia |
128 |
398 |
3.510 |
315 |
1 |
4.352 |
|
Qaasuitsup Kommunia |
123 |
533 |
284 |
6.225 |
4 |
7.169 |
|
Other localities |
1 |
8 |
1 |
3 |
- |
13 |
Visit our Statbank: ( http://bank.stat.gl/beebaf2b )
Graph 3. Net internal migrations in the municipalities 1993-2014
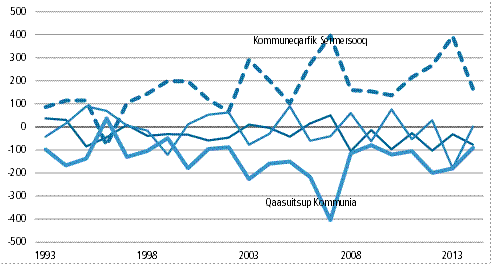
Visit our Statbank: ( http://bank.stat.gl/beebbaf2